https://archive.triblive.com/sports/pirates/for-mlb-teams-question-is-how-to-slice-payroll-pie/
For MLB teams, question is how to slice payroll pie

Christopher Horner | Trib Total Media
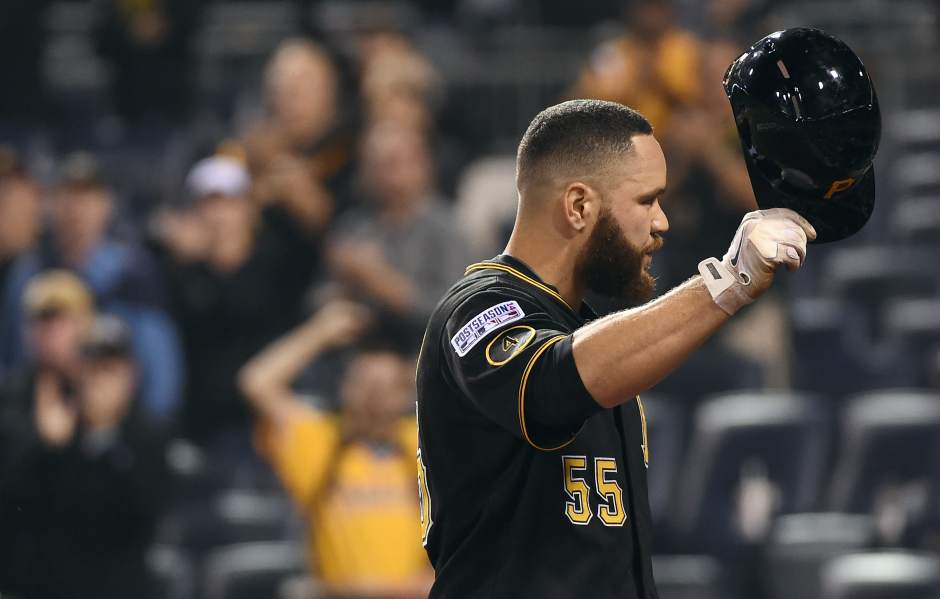
Pirates catcher Russell Martin tips his cap to the crowd after flying out during the ninth inning of the National League wild-card game against the Giants on Wednesday, Oct. 1, 2014, at PNC Park.
The Pirates have asked themselves an important question in preparing for this offseason: How should they slice up the pie?
The Pirates have to make decisions on free agents, such as Russell Martin, Francisco Liriano and Edinson Volquez, and have almost twice as many arbitration-eligible players as they came to terms with a year ago.
General managers do not determine payroll, but they have a significant role in distributing it. To understand how best to allocate dollars, Pirates general manager Neal Huntington has had his staff re-evaluate the team's payroll models entering the offseason. Free agents can begin signing with teams Tuesday.
In an effort to understand how successful teams distribute dollars ÔÇö and perhaps glean insight into the Pirates' decision-making process ÔÇö Trib Total Media conducted its own payroll study. The Trib studied how the past 46 major league playoff teams allocated payroll. One common theme? Few teams place too many eggs in one star's bank account.
Slices of pie
In studying major league playoff teams over the past five years, the Trib found the average team spent 14.6 percent of its Opening Day payroll on its highest-paid player, according to contract numbers analyzed from BaseballProspectus.com. Last season the Pirates only were slightly below that mark, paying Russell Martin 13.2 percent of their payroll.
There is compelling evidence clubs should not overpay for one player.
Consider: Of the past 46 major league playoff teams, only nine spent more than 17 percent of their payroll on a single player, and only one ÔÇö the 2010 Texas Rangers ÔÇö spent more than 20 percent of payroll on one player (Michael Young). The majority of teams studied ÔÇö 72 percent ÔÇö spent between 12 percent and 16 percent of payroll on their more expensive player.
The one-year, $15.3 million qualifying offer the Pirates are expected to extend to Martin represents 17 percent of a $90 million payroll. The Pirates' final 40-man payroll last season was $82 million.
There are those who want Pirates owner Bob Nutting to expand the pie. Still, regardless of payroll size, distribution of payroll is nearly uniform across market size. Over the past five seasons, 22 playoff teams have had payrolls below $100 million, and those teams distributed payroll similarly to large-market teams.
Why do clubs rarely commit a large slice of payroll to a star? Former Mets general manager and MLB Network Radio analyst Jim Duquette explained.
ÔÇ£In football, your quarterback and in the NBA your best player control the ball so much during the course of the game. So if you pay him a higher percentage of your payroll, well, OK, he is a good enough of player he can control (the game),ÔÇØ Duquette said. ÔÇ£In baseball, you just can't control it that way.ÔÇØ
Need more evidence in the risk of cutting large slices of payroll to one player?
According to research by the Cleveland Indians reported by the Cleveland Plain Dealer, and updated by Trib Total Media, only three World Series-winning teams since 1985 have spent more than 15 percent of payroll on one player: the 2010 San Francisco Giants (Barry Zito, 18.2 percent), 2004 Boston Red Sox (Manny Ramirez, 17.3 percent) and 2003 Florida Marlins (Ivan Rodriguez, 15.8 percent).
ÔÇ£When you have a lack of depth, you are not going to make it as far,ÔÇØ Duquette said. ÔÇ£You have to spread out your resources more judiciously. It is interesting how consistent (payroll distribution) has been. That is one thing that surprises me.ÔÇØ
The uniformity also is striking in how teams pay the top fifth of their rosters.
Only eight playoff teams of the past five years spent 60 percent or more of payroll on their five highest-paid players.
Teams studied spent 54.5 percent of their dollars on their five most expensive players. Last season, the Pirates spent 50.4 percent on their five most expensive players.
Raymond Sauer, an economists professor at Clemson and SportsEconomist.com founder, said the process of paying players and determining payroll has become scientific.
ÔÇ£The market for talent in baseball is very carefully studied by a lot of people right now, and it gets reflected in what people are willing to pay the players,ÔÇØ Sauer said. ÔÇ£We are really looking at an equilibrium phenomenon.ÔÇØ
Big dollars, little return
There is another reason a large a slice of payroll to one player is generally a bad idea: That player often is not a team's most productive player.
Consider: Of the 46 teams to advance to the playoffs since 2010, only two teams' most productive players according to Wins Above Replacement ÔÇö Joey Votto (Reds, 2013) and Miguel Cabrera (Tigers, 2011) ÔÇö also were their top-compensated players. The salient reason for this is free agency is inefficient. Players are underpaid during in their 20s and are often overpaid as free agents when they begin to decline in their 30s.
ÔÇ£You are really paying for past performance,ÔÇØ Duquette said of free agency. ÔÇ£I don't see how teams can continue to pay these $150-million-plus contracts and expect productivity. ... The majority (of teams) are not going to go that route. You're going to see the mid-level (free agents) get a little more and the bottom (tier free agents) get paid a little more.
ÔÇ£We have already started to see it, but we are going to see more of it: a shift of signing up younger players to long-term contracts and a reversal on the free agent market.ÔÇØ
Said Huntington in late September: ÔÇ£We're going to continue to have to pay guys for what we believe they're going to do and not what they've done.ÔÇØ
Guns vs. butter debate
In the past five years, playoff teams have favored paying bats over arms.
Playoff teams have spent 55 percent of their dollars on position players and 45 percent on pitchers. Why? Pitchers carry more injury risk. The spike in Tommy John surgeries is well documented. Moreover, Dodgers head trainer Stan Conte found one of two pitchers each year will land on the disabled list.
ÔÇ£We were first made aware of (the Tommy John surge) when we couldn't get insurance on pitchers for more than three or four years. That hasn't changed much at all,ÔÇØ Duquette said. ÔÇ£Teams got smart and said, ÔÇÿWe better be careful. If we are going to give long-term contracts, we are going to give them to position players.' ÔÇØ
More specifically, Sauer said, economists ÔÇö and no doubt teams ÔÇö have investigated whether there is an optimal way to allocate dollars by position.
ÔÇ£You think of constructing a team (and targeting) a certain amount of wins: Is there a way to do that less expensively?ÔÇØ Sauer said.
ÔÇ£Do you want equal amounts of talents across positions? Or would you want to concentrate in a couple of positions? The results haven't really leaped off the page.ÔÇØ
The Pirates are the only playoff team of the past five years to make a catcher ÔÇö Martin ÔÇö their highest paid player. Still, in 2003 the Marlins made catcher Ivan Rodriguez their highest-paid player, allotting him 16 percent of their payroll. The Marlins won the World Series.
Travis Sawchik is a staff writer for Trib Total Media. Reach him at tsawchik@tribweb.com or via Twitter @Sawchik_Trib.
Copyright ©2025— Trib Total Media, LLC (TribLIVE.com)